Categories
Display User Interface

Switch on and off topics in the data visualization

New feature in PageOneX.com: now you can switch topics on and off in the data visualization just by clicking on the topics in the legend.
New ways to understand your data.

Activate, deactivate layers and enjoy.

Test it here or here!

In den Arsch meiner alten Frau – nackte Muskel-Bodybuilding-Frauen – spanische Videos super drol Broncholithin im Bodybuilding – Kalorientabellenmehr lesen.
Categories
Display

Bring your PageOneX where you need: Embed code is available

The embed code we announced two weeks ago is now available to everyone.

Copy paste the embed code!

Now you can copy paste directly from the the embed code to insert a PageOneX visualization in your site. Check at the bottom right and share your PageOneX dataviz where you need them.

It still needs some fixes of height and zoom level, but I am sure you will work it out.

Besides, we’ve also redesigned the display view to make it more compact and show the dataviz in a more prominent way. We’ve also avoided the duplication of the topics list.

Tell us how do you like it.

Old and new designs.
Categories
Display

Embed a PageOneX dataviz in your site

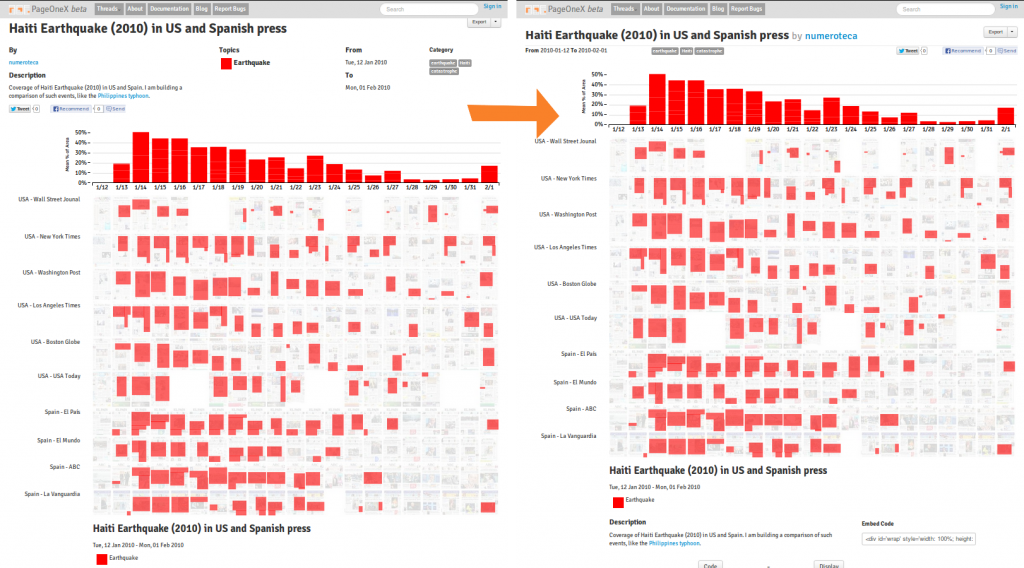
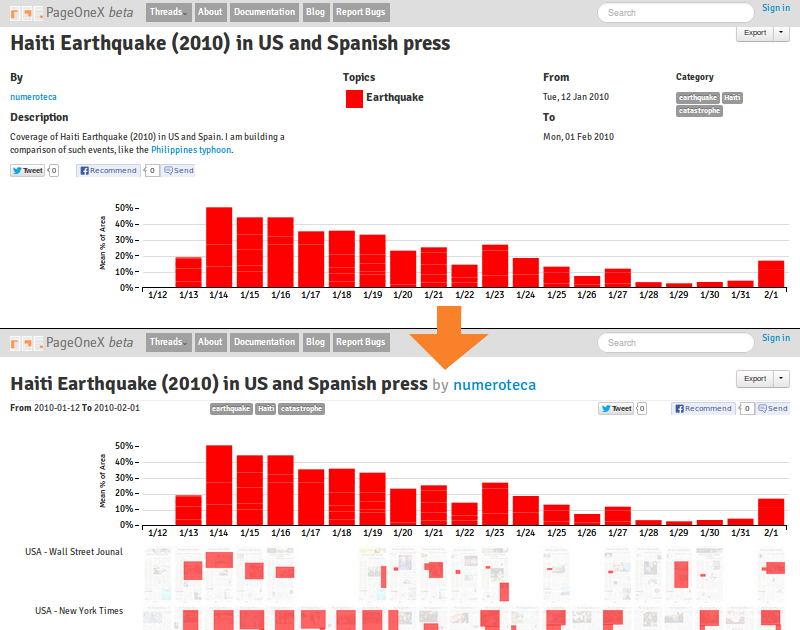
Now you can embed a PageOneX thread in your site:

You can check this thread at PageOneX > Corrupción España. Octubre 2013.

To get the embedded version you just need to add “/embed” at the end of the url http://pageonex.com/numeroteca/corrupcion-espana-octubre-2013/embed
and embed that web page with an iframe.
This version of the display view is the same as the normal thread, but wihout the header (navigation bar, description, vertical legend) and footer.
You will have to play with the scale and height of the div and iframe to make it look good.

Code to embed:

<div id="wrap" style="width: 100%; height: 490px; padding: 0; overflow: hidden;">
 <iframe style="width: 1280px; height: 700px; -ms-zoom: 0.68; -transform: scale(0.68);
 -moz-transform: scale(0.68); -moz-transform-origin: 0 0; -o-transform: scale(0.68);
 -o-transform-origin: 0 0; -webkit-transform: scale(0.68); -webkit-transform-origin: 0 0;
 max-width: none; overflow: hidden; border: 1px solid white;"
 src="http://pageonex.com/numeroteca/corrupcion-espana-octubre-2013/embed">
 </iframe></div>

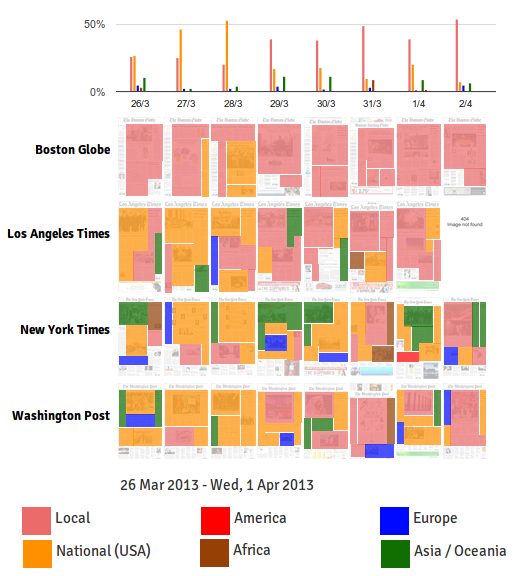
Another example about Coverage of Gezi Park protests in Turkish newspapers last June.

 
Categories
Display

Opacity tests for the front page images: coded/uncoded

The front page images in the display view are displayed differently if they have been coded or not. It makes easier for the user to know intuitively which images have been coded (more transparent) with the ones that hasn’t (more opaque).

I’ve been testing with different opacities: make both uncoded and coded images lose opacity, and color codes to lose transparency. Related commit.

Check the tests:

Coded: 0.65
Uncoded: 1
Coded: 0..3
Uncoded: 1
Coded: 0.15
Uncoded: 1
Opacity of color codes: from 0.5 to 0.6

and the finaland chosen selection:

Coded: 0.15
Uncoded: 0.6
Categories
Display

Guns, Wars and Terrorism in a real size PageOneX (photo essay)

visitor-1

I finally installed the PageOneX real size project with stories related to guns, wars and terrorism. Come visit the display this week to the second floor of building E14 at MIT Media Lab. Thanks all of you that helped in this process: Adrienne, Luis, Álvaro, Nacho and Matjaz!

What follows is a photographic guide to the PageOneX real size installation.

Categories
Display

A quick test with Local / National / by Continent news

After the post Guns vs Sports vs Wars I wanted to test news by location: local, for news related to the city or region where the newspaper is published; national for US news; and continent (as Ethan suggested). This visualizations fits pretty well with the previous one, as it fills the gaps of the more locally oriented newspapers like The Boston Globe and LA Times.

I do not think I will use this approach in the final PageOneX real size version, but it is interesting to view the same newspapers coded by different ways. I can imagine a par of special glasses that would allow the viewer shift from one visualization to another.

Note: I have only coded the main news (only the big ones).

Crossposted from numeroteca.org

Categories
Display

Preparing PageOneX 1:1 scale and front page analysis references

Preparing PageOneX 1:1 scale

PageOneX: How newspapers tell the story proposal for the Media Lab Festival
PageOneX: How newspapers tell the story? This is how the project would look like at the MIT Media Lab Festival

I am preparing a project for a physical display of a PageOneX visualization at the MIT Media Lab Festival for April 2013. I blogged about it and also gathered some references about front pages in art and cinema.

Front page analysis references

We’ve opened (with Rogelio López) a section of the website to gather articles and books related to front page analysis.

This is the open document: http://brownbag.me:9001/p/pageonex-references
I’ve also copy-pasted the content into one of the sections of the pageoenx blog: http://montera34.org/pageonex/references/

Help us get more examples of front page analysis!

Updates on PageOneX development

Testing a new way of visualizing all the threads.

I hope that by late April we’ll have a new version of pageonex.com available. You can check all the things that we are fixing or suggest yours.

Meanwhile you can use the buggy alpha version or install it in your own computer.

Categories
Display User Interface

Display View – An Overview

In the last post I’ve did an overview of how Coding works, so in this post I’ll walk you through the Display view and how it works

Let’s start with the basic structure of the display view it self;

Display view is divided mainly into three horizontal sections

  1. First section; contains information about the thread, basic information (name, description, status, starting date and ending date) and then number of boxes representing the  codes and their colors
  2. Second section; contains the bar chart of the calculated “Surfaces Percentage”, it’s not working in this snapshot but it will be working soon.
    We are using Rickshaw which is JavaScript toolkit for creating interactive real-time graphs, and to use it we have to include three files as the following
    <%= javascript_include_tag “d3.min.js”, “d3.layout.min.js”, “rickshaw.min.js” %> and then create an object from Rickshaw.Graph and pass the JSON object of the information to display which is the surfaces percentage for each day in set of images from different magazines, I’ll write about how this values can be calculate exactly in another post after deploying the beta version
  3. Last section which showing the the highlighted images, each newspaper images appears in an individual row
    I’ll try to explain here how we load this images and arrange them in rows and calculate the size of highlighted areas and their position;

    1. First how to calculate the size of the images based on the size of the page, specifically the size of the div which contains the images of a newspaper:
      1. gets the width of the row div which contains images for any newspaper
      2. gets the number of images in a row
      3. divide this width by the number of the images, to specify the height of each image
      4. then calculate the ratio between the original image and the new image size
      5. based on this values I do set the images size and highlighted areas
Try to zoom in and out and you will see how the images and the highlighted areas are calculated, that is happen because I’ve also bind the handler with resize event on the window object