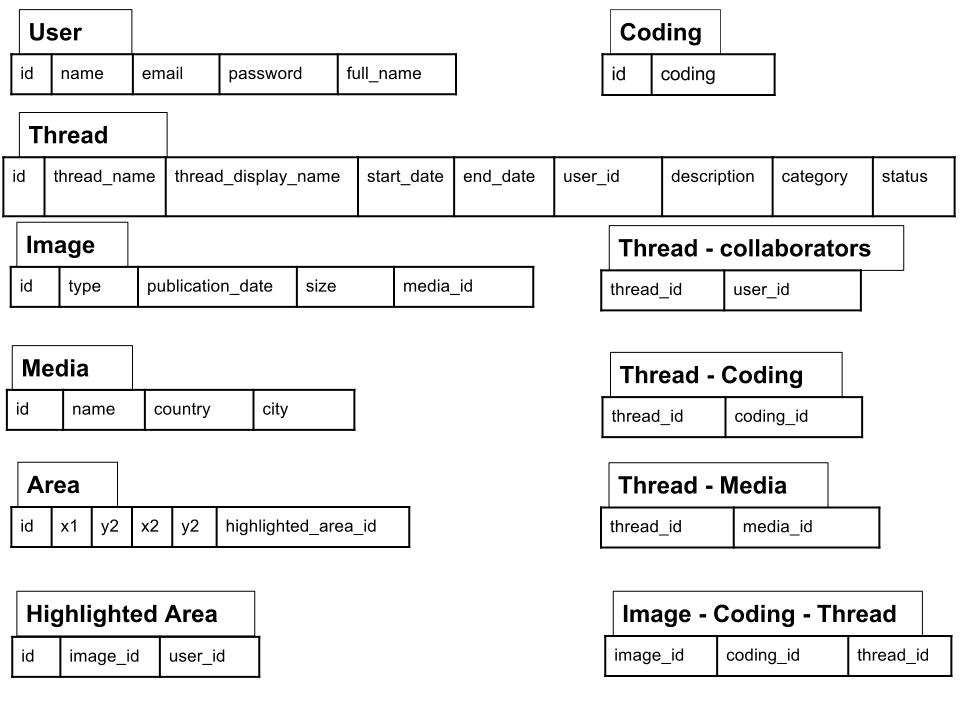
Brief description of the data models

1. User: each user that uses the tool to build a visualization should create an account.
2. Thread: this is the main model which represents the visualized data with its related information:
- thread_name: url-friendly
- thread_display_name: full name
- user_id: creator of thread
- category: predefined words / or better use tags / or both
- description: short text
- status: open thread will add newspapers every date (will change end date) but should have a limit
3. Image: represent a snapshot of a media to code, it could be a newspaper front page or a magazine cover or even an online newspaper home page or a blog.
4. Media: different media can be represent, and identified by their country and city. It will be extended in the future to cover more different media types.
5. Highlighted Area: this model used to store the coordination of the highlighted area(s)
Questions: Non rectangular news: http://img.kiosko.net/2012/06/11/us/newyork_times.750.jpg how to id?
Possible solution:
- Multiple area selection
- Select and remove a part of the selection after selecting the main article
6. Area: holds the coordinates of each specified area.
7. Coding: stores the coding that the user have created.
Other models are for association between the models.